 Building a site with a great user experience (UX) design can be a quite boring task to go into blind. We are aware of the greatness of Google Analytics yet analyzing it’s data can get confusing and irritating if are not quite sure where to begin. That’s why heat-mapping technology can not only optimize the heck out of your website, but can also get help you get a date.
Although it would be kind of cool to see a transparent map drape over the person you are interested, but until that happens let us just relate the two to each other.
Heatmaps on a site can tell you…
• The spots your visitors are focusing on (mouse movements)
• Where your visitors are clicking (clicks)
• How visitors are responding to changes you just made (live clicks)
• Scroll rate (scrolling)
Website heatmaps offer webmasters a chance to get inside their users heads and see how they are interacting with a site.
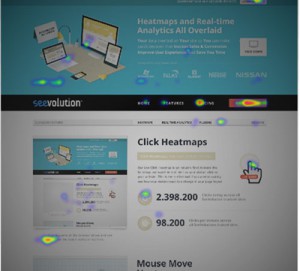
Instead of combing through analytics to make decisions about website design, for about a year SeeVolution users have been able to view free real-time heat maps of traffic with the startup’s beta product. SeeVolution, providers of real-time website analytics, recently introduced a ‘Heat map’ tab to their custom toolbar and a faster, more efficient loading time to their heat map overlays. It also has announced it is ending its beta and instating a freemium model with features equipped to handle bigger sites. This tool has many features such as custom toolbar and a faster, more efficient loading time to their heat map overlays.
SeeVolution offers website owners a unique, instinctive experience that instantly grants them access to the real-time behavioral analytics and eye-tracking of their website users. The company’s innovative product and growth have earned them favorable praise from top technology blogs all over the world.
Very supportive article.I understand every point in this blog about good topic.