 A good data presentation is an important phase in web industry because it is the key to let visitors understand your content easily and simple manner. If you want to reveal your professionalism in handling presentation, you should let your visitor to know your content as faster as they can. Criteria for a decent data presentation should be simple yet descriptive, well elaborated but manage to maintain a user’s interest, convenient to compare and most importunately user should be able to make decisions or conclude the data presented easily.
For this post, we want to take you on tour for several styles to beautiful and creative data visualization tools that are entirely base on CSS/HTML.

Horizontal Barchart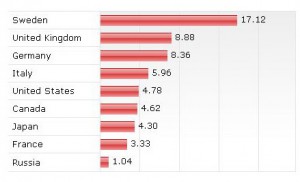
It provides a simple way of displaying the statistical figure as an overview with this accessible bar chart using CSS.
CSSplay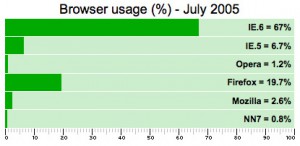
Bar charts provided in these visualizations are a definitive list with styles and classes defined in each line. The first chart has an error which occurs when the values get closer to 100% which is corrected in the second chart.
Percentage Bargraph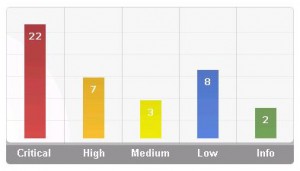
Using the percentage width property of CSS, a percentage based bar graph can be created in this tutorial.
Maxdesign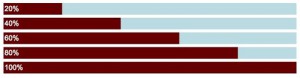
In this tutorial you can learn to create a graph based on percentage and using background images. Code and images linked can be downloaded to employ in your own project.
Vertical Barchart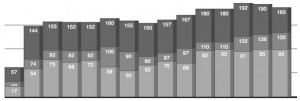
Here is the tutorial to create vertical bar graphs using CSS and PHP by creating a simple list with height in pixels of individual bar, y-axis of the bar group and class to represent data sets.
Datachart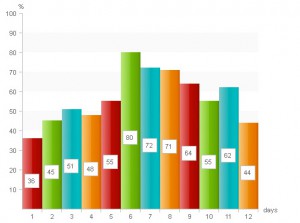
Alen Grakalic teaches you to build a data chart using CSS and markup using a structural and semantically definition list where definition titles can be on the x-axis and description on y axis.
Pure CSS Linegraph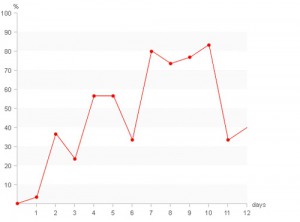
In this tutorial, you will learn to create a line graph with CSS using HTML, replace the text with images and use CSS sprites and absolute positioning to get a line graph.
Simple Linegraph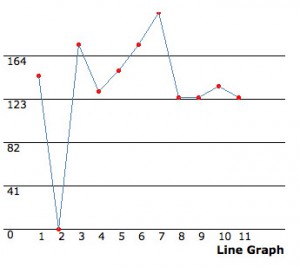
This is the simplest line graph that uses only DHTML and CSS and where you can set a transparent background for visualizing graph.
Mgraph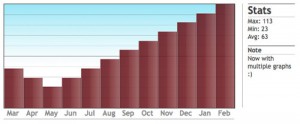
This Ajax based graph is used to represent data of a year according to each month using only CSS and XHTML and runs in Firefox and Opera.
Multicolumn Lists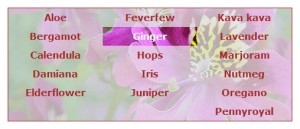
Bulletgraph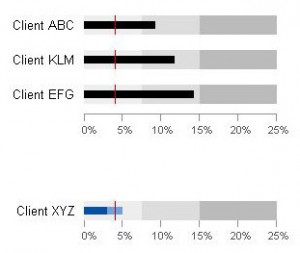
Column Bargraph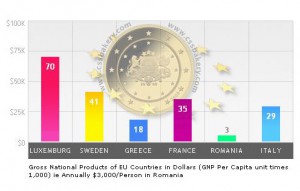
Downtime Graph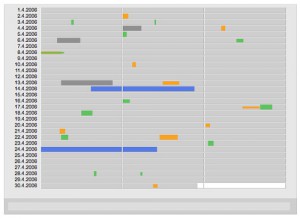
Dynamic Live CSS Graph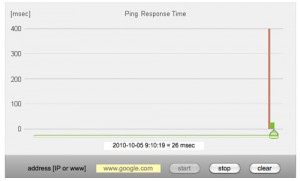
Horizontal Bargraph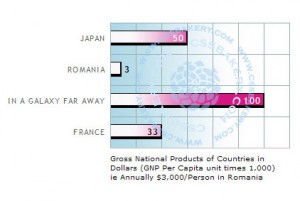
Multigraph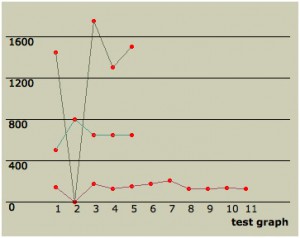
Production Plan Graph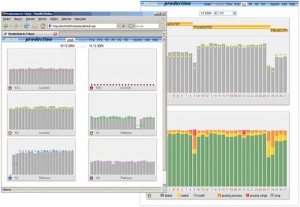
Sandwich Graph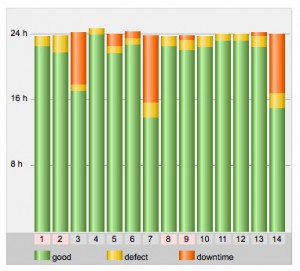
Stacked Bargraph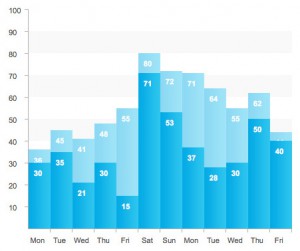
Simple Bargraph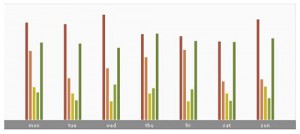
Vertical Bar Graph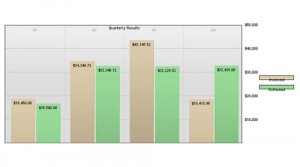
Piegraph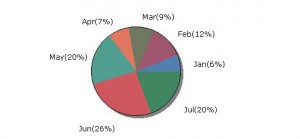
Plotkit Piechart
Other CSS Visualisation Tools
Visual CSS Maps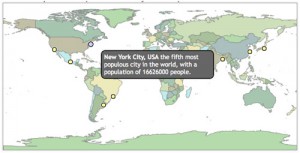
Animated Progress Bar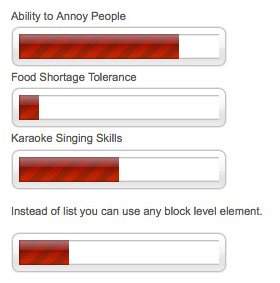
CSS Timeline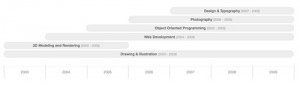
Slickmap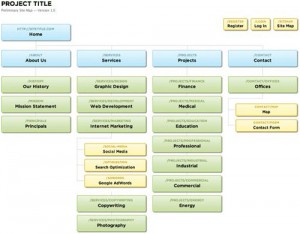
Scrollable CSS Table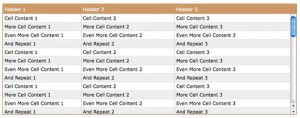
Did we miss out any other data visualization tool which you found useful? Do let us know and share it with us.